|
From here 1) How would you create a taxonomy to identify key customer trends in unstructured data? Tweet: Data Science Interview questions #1 - How would you create a taxonomy to identify key customer trends in unstructured data? - http://ctt.ec/sdqZ0+ The best way to approach this question is to mention that it is good to check with the business owner and understand their objectives before categorizing the data. Having done this, it is always good to follow an iterative approach by pulling new data samples and improving the model accordingly by validating it for accuracy by soliciting feedback from the stakeholders of the business. This helps ensure that your model is producing actionable results and improving over the time. 2) Python or R – Which one would you prefer for text analytics? The best possible answer for this would be Python because it has Pandas library that provides easy to use data structures and high performance data analysis tools. 3) Which technique is used to predict categorical responses? Classification technique is used widely in mining for classifying data sets. 4) What is logistic regression? Or State an example when you have used logistic regression recently. Logistic Regression often referred as logit model is a technique to predict the binary outcome from a linear combination of predictor variables. For example, if you want to predict whether a particular political leader will win the election or not. In this case, the outcome of prediction is binary i.e. 0 or 1 (Win/Lose). The predictor variables here would be the amount of money spent for election campaigning of a particular candidate, the amount of time spent in campaigning, etc. 5) What are Recommender Systems? A subclass of information filtering systems that are meant to predict the preferences or ratings that a user would give to a product. Recommender systems are widely used in movies, news, research articles, products, social tags, music, etc. 6) Why data cleaning plays a vital role in analysis? Cleaning data from multiple sources to transform it into a format that data analysts or data scientists can work with is a cumbersome process because - as the number of data sources increases, the time take to clean the data increases exponentially due to the number of sources and the volume of data generated in these sources. It might take up to 80% of the time for just cleaning data making it a critical part of analysis task. 7) Differentiate between univariate, bivariate and multivariate analysis. These are descriptive statistical analysis techniques which can be differentiated based on the number of variables involved at a given point of time. For example, the pie charts of sales based on territory involve only one variable and can be referred to as univariate analysis. If the analysis attempts to understand the difference between 2 variables at time as in a scatterplot, then it is referred to as bivariate analysis. For example, analysing the volume of sale and a spending can be considered as an example of bivariate analysis. Analysis that deals with the study of more than two variables to understand the effect of variables on the responses is referred to as multivariate analysis. 8) What do you understand by the term Normal Distribution? Data is usually distributed in different ways with a bias to the left or to the right or it can all be jumbled up. However, there are chances that data is distributed around a central value without any bias to the left or right and reaches normal distribution in the form of a bell shaped curve. The random variables are distributed in the form of an symmetrical bell shaped curve. 9) What is Linear Regression? Linear regression is a statistical technique where the score of a variable Y is predicted from the score of a second variable X. X is referred to as the predictor variable and Y as the criterion variable. 10) What is Interpolation and Extrapolation? Estimating a value from 2 unknown values from a list of values is Interpolation. Extrapolation is approximating a value by extending a known set of values or facts. 11) What is power analysis? An experimental design technique for determining the effect of a given sample size. 12) What is K-means? How can you select K for K-means? 13) What is Collaborative filtering? The process of filtering used by most of the recommender systems to find patterns or information by collaborating viewpoints, various data sources and multiple agents. 14) What is the difference between Cluster and Systematic Sampling? Cluster sampling is a technique used when it becomes difficult to study the target population spread across a wide area and simple random sampling cannot be applied. Cluster Sample is a probability sample where each sampling unit is a collection, or cluster of elements. Systematic sampling is a statistical technique where elements are selected from an ordered sampling frame. In systematic sampling, the list is progressed in a circular manner so once you reach the end of the list,it is progressed from the top again. The best example for systematic sampling is equal probability method. 15) Are expected value and mean value different? They are not different but the terms are used in different contexts. Mean is generally referred when talking about a probability distribution or sample population whereas expected value is generally referred in a random variable context. For Sampling Data Mean value is the only value that comes from the sampling data. Expected Value is the mean of all the means i.e. the value that is built from multiple samples. Expected value is the population mean. For Distributions Mean value and Expected value are same irrespective of the distribution, under the condition that the distribution is in the same population. 16) What does P-value signify about the statistical data? P-value is used to determine the significance of results after a hypothesis test in statistics. P-value helps the readers to draw conclusions and is always between 0 and 1. • P- Value > 0.05 denotes weak evidence against the null hypothesis which means the null hypothesis cannot be rejected. • P-value <= 0.05 denotes strong evidence against the null hypothesis which means the null hypothesis can be rejected. • P-value=0.05is the marginal value indicating it is possible to go either way. 17) Do gradient descent methods always converge to same point? No, they do not because in some cases it reaches a local minima or a local optima point. You don’t reach the global optima point. It depends on the data and starting conditions 18) What are categorical variables? 19) A test has a true positive rate of 100% and false positive rate of 5%. There is a population with a 1/1000 rate of having the condition the test identifies. Considering a positive test, what is the probability of having that condition? Let’s suppose you are being tested for a disease, if you have the illness the test will end up saying you have the illness. However, if you don’t have the illness- 5% of the times the test will end up saying you have the illness and 95% of the times the test will give accurate result that you don’t have the illness. Thus there is a 5% error in case you do not have the illness. Out of 1000 people, 1 person who has the disease will get true positive result. Out of the remaining 999 people, 5% will also get true positive result. Close to 50 people will get a true positive result for the disease. This means that out of 1000 people, 51 people will be tested positive for the disease even though only one person has the illness. There is only a 2% probability of you having the disease even if your reports say that you have the disease. 20) How you can make data normal using Box-Cox transformation? 21) What is the difference between Supervised Learning an Unsupervised Learning? If an algorithm learns something from the training data so that the knowledge can be applied to the test data, then it is referred to as Supervised Learning. Classification is an example for Supervised Learning. If the algorithm does not learn anything beforehand because there is no response variable or any training data, then it is referred to as unsupervised learning. Clustering is an example for unsupervised learning. 22) Explain the use of Combinatorics in data science. 23) Why is vectorization considered a powerful method for optimizing numerical code? 24) What is the goal of A/B Testing? It is a statistical hypothesis testing for randomized experiment with two variables A and B. The goal of A/B Testing is to identify any changes to the web page to maximize or increase the outcome of an interest. An example for this could be identifying the click through rate for a banner ad. 25) What is an Eigenvalue and Eigenvector? Eigenvectors are used for understanding linear transformations. In data analysis, we usually calculate the eigenvectors for a correlation or covariance matrix. Eigenvectors are the directions along which a particular linear transformation acts by flipping, compressing or stretching. Eigenvalue can be referred to as the strength of the transformation in the direction of eigenvector or the factor by which the compression occurs. 26) What is Gradient Descent? 27) How can outlier values be treated? Outlier values can be identified by using univariate or any other graphical analysis method. If the number of outlier values is few then they can be assessed individually but for large number of outliers the values can be substituted with either the 99th or the 1st percentile values. All extreme values are not outlier values.The most common ways to treat outlier values – 1) To change the value and bring in within a range 2) To just remove the value. 28) How can you assess a good logistic model? There are various methods to assess the results of a logistic regression analysis- • Using Classification Matrix to look at the true negatives and false positives. • Concordance that helps identify the ability of the logistic model to differentiate between the event happening and not happening. • Lift helps assess the logistic model by comparing it with random selection. 29) What are various steps involved in an analytics project? • Understand the business problem • Explore the data and become familiar with it. • Prepare the data for modelling by detecting outliers, treating missing values, transforming variables, etc. • After data preparation, start running the model, analyse the result and tweak the approach. This is an iterative step till the best possible outcome is achieved. • Validate the model using a new data set. • Start implementing the model and track the result to analyse the performance of the model over the period of time. 30) How can you iterate over a list and also retrieve element indices at the same time? This can be done using the enumerate function which takes every element in a sequence just like in a list and adds its location just before it. 31) During analysis, how do you treat missing values? The extent of the missing values is identified after identifying the variables with missing values. If any patterns are identified the analyst has to concentrate on them as it could lead to interesting and meaningful business insights. If there are no patterns identified, then the missing values can be substituted with mean or median values (imputation) or they can simply be ignored.There are various factors to be considered when answering this question-
33) Can you use machine learning for time series analysis? Yes, it can be used but it depends on the applications. 34) Write a function that takes in two sorted lists and outputs a sorted list that is their union. 35) What is the difference between Bayesian Inference and Maximum Likelihood Estimation (MLE)? 36) What is Regularization and what kind of problems does regularization solve? 37) What is multicollinearity and how you can overcome it? 38) What is the curse of dimensionality? 39) How do you decide whether your linear regression model fits the data? 40) What is the difference between squared error and absolute error? 41) What is Machine Learning? The simplest way to answer this question is – we give the data and equation to the machine. Ask the machine to look at the data and identify the coefficient values in an equation. For example for the linear regression y=mx+c, we give the data for the variable x, y and the machine learns about the values of m and c from the data. 42) How are confidence intervals constructed and how will you interpret them? 43) How will you explain logistic regression to an economist, physican scientist and biologist? 44) How can you overcome Overfitting? 45) Differentiate between wide and tall data formats? 46) Is Naïve Bayes bad? If yes, under what aspects. 47) How would you develop a model to identify plagiarism? 48) How will you define the number of clusters in a clustering algorithm? 49) Is it better to have too many false negatives or too many false positives? 50) Is it possible to perform logistic regression with Microsoft Excel? 51) What do you understand by Fuzzy merging ? Which language will you use to handle it? 52) What is the difference between skewed and uniform distribution? 53) You created a predictive model of a quantitative outcome variable using multiple regressions. What are the steps you would follow to validate the model? 54) What do you understand by Hypothesis in the content of Machine Learning? 55) What do you understand by Recall and Precision? 56) How will you find the right K for K-means? 57) Why L1 regularizations causes parameter sparsity whereas L2 regularization does not? 58) How can you deal with different types of seasonality in time series modelling? 59) In experimental design, is it necessary to do randomization? If yes, why? 60) What do you understand by conjugate-prior with respect to Naïve Bayes? 61) Can you cite some examples where a false positive is important than a false negative? 62) Can you cite some examples where a false negative important than a false positive? 63) Can you cite some examples where both false positive and false negatives are equally important? 64) Can you explain the difference between a Test Set and a Validation Set? Validation set can be considered as a part of the training set as it is used for parameter selection and to avoid Overfitting of the model being built. On the other hand, test set is used for testing or evaluating the performance of a trained machine leaning model. In simple terms ,the differences can be summarized as-
66) What do you understand by statistical power of sensitivity and how do you calculate it? 67) What is the importance of having a selection bias? 68) Give some situations where you will use an SVM over a RandomForest Machine Learning algorithm and vice-versa. 69) What do you understand by feature vectors? 70) How do data management procedures like missing data handling make selection bias worse? 71) What are the advantages and disadvantages of using regularization methods like Ridge Regression? 72) What do you understand by long and wide data formats? 73) What do you understand by outliers and inliers? What would you do if you find them in your dataset? 74) Write a program in Python which takes input as the diameter of a coin and weight of the coin and produces output as the money value of the coin. Data Science Puzzles-Brain Storming/ Puzzle Questions asked in Data Science Job Interviews1) How many Piano Tuners are there in Chicago?
To solve this kind of a problem, we need to know – How many Pianos are there in Chicago? How often would a Piano require tuning? How much time does it take for each tuning? We need to build these estimates to solve this kind of a problem. Suppose, let’s assume Chicago has close to 10 million people and on an average there are 2 people in a house. For every 20 households there is 1 Piano. Now the question how many pianos are there can be answered. 1 in 20 households has a piano, so approximately 250,000 pianos are there in Chicago. Now the next question is-“How often would a Piano require tuning? There is no exact answer to this question. It could be once a year or twice a year. You need to approach this question as the interviewer is trying to test your knowledge on whether you take this into consideration or not. Let’s suppose each piano requires tuning once a year so on the whole 250,000 piano tunings are required. Let’s suppose that a piano tuner works for 50 weeks in a year considering a 5 day week. Thus a piano tuner works for 250 days in a year. Let’s suppose tuning a piano takes 2 hours then in an 8 hour workday the piano tuner would be able to tune only 4 pianos. Considering this rate, a piano tuner can tune 1000 pianos a year. Thus, 250 piano tuners are required in Chicago considering the above estimates. 2) There is a race track with five lanes. There are 25 horses of which you want to find out the three fastest horses. What is the minimal number of races needed to identify the 3 fastest horses of those 25? Divide the 25 horses into 5 groups where each group contains 5 horses. Race between all the 5 groups (5 races) will determine the winners of each group. A race between all the winners will determine the winner of the winners and must be the fastest horse. A final race between the 2nd and 3rd place from the winners group along with the 1st and 2nd place of thee second place group along with the third place horse will determine the second and third fastest horse from the group of 25. 3) Estimate the number of french fries sold by McDonald's everyday. 4) How many times in a day does a clock’s hand overlap? 5) You have two beakers. The first beaker contains 4 litre of water and the second one contains 5 litres of water.How can you our exactly 7 litres of water into a bucket? 6) A coin is flipped 1000 times and 560 times heads show up. Do you think the coin is biased? 7) Estimate the number of tennis balls that can fit into a plane. 8) How many haircuts do you think happen in US every year? 9) In a city where residents prefer only boys, every family in the city continues to give birth to children until a boy is born. If a girl is born, they plan for another child. If a boy is born, they stop. Find out the proportion of boys to girls in the city. Probability and Statistics Interview Questions for Data Science
Suggested Answers by Data Scientists for Open Ended Data Science Interview Questions How can you ensure that you don’t analyse something that ends up producing meaningless results?
- Gaganpreet Singh,Data Scientist 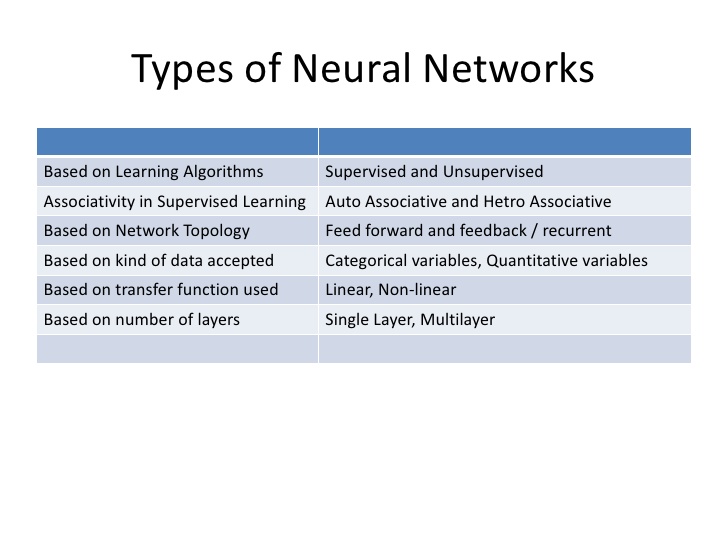 Not surprisingly, I had to work on deep learning to see if it helps my research. So the one I will attack the recurrent neural network.
In the beginning, I am not a big fan of data exploration. However, after a while I think it is very important to get some shallow knowledge from the data. After all, we don't really need to find a true but subtle knowledge from the things we learn, like random forest or other advanced techniques of machine learning.
1. scatter matrix plot Where to call: from pandas.tools.plotting import scatter_matrix How to use: scatter_matrix(df, alpha=0.2, figsiz=(3,3), diagonal='kde') # kde means: kernel density estimation, which is an non-parametric method to get a smoothed distribution for density function from finite number of data.  Gaussian mixture model A Gaussian mixture model is a probabilistic model that assumes all the data points are generated from a mixture of a finite number of Gaussian distributions with unknown parameters. Although it is an unsupervised learning, the number of components need to be assigned before calculation. supervised learning evaluation
two clusterings by considering all pairs of samples and counting pairs that are assigned in the same or different clusters in the predicted and true clusterings. -- for rand score: rand index: The Rand index has a value between 0 and 1, with 0 indicating that the two data clusters do not agree on any pair of points and 1 indicating that the data clusters are exactly the same. For smaller sample sizes or larger number of clusters, it is safer to use an adjusted index such as the Adjusted Rand Index (ARI)
of the two assignments, ignoring permutations.
homo is 1.0...so more cluster, the homogeneity will be higher! because the number of points in each cluster is reduced to 1 for an extreme example.
tip: switching pred and true will switch result to homogeneity
-- although homogeneity and completeness along is not meaningful as we have seen their harmonic mean is very good at capturing the point 3 optimal cluster number. unsupervised learning evaluation
Negative values generally indicate that a sample has been assigned to the wrong cluster, as a different cluster is more similar. K-MEANThe KMeans algorithm clusters data by trying to separate samples in n groups of equal variance, minimizing a criterion known as the inertia or within-cluster sum-of-squares. The K-means algorithm aims to choose centroids that minimise the inertia, or within-cluster sum of squared criterion. However, there are some drawbacks of K-Mean method:
Hierarchical clusteringHierarchical clustering is a general family of clustering algorithms that build nested clusters by merging or splitting them successively. This hierarchy of clusters is represented as a tree (or dendrogram). The root of the tree is the unique cluster that gathers all the samples, the leaves being the clusters with only one sample. Novelty & Outlier Detection One-class SVM is an unsupervised algorithm that learns a decision function for novelty detection: classifying new data as similar or different to the training set. In this case, as it is a type of unsupervised learning, the fit method will only take as input an array X, as there are no class labels. ensemble modelsThe goal of ensemble methods is to combine the predictions of several base estimators built with a given learning algorithm in order to improve generalizability / robustness over a single estimator. So it's a methodology in system level to reduce the variance of a model Two families of ensemble models
bagging methodA Bagging regressor is an ensemble meta-estimator that fits base regressors each on random subsets of the original dataset and then aggregate their individual predictions (either by voting or by averaging) to form a final prediction. Such a meta-estimator can typically be used as a way to reduce the variance of a black-box estimator (e.g., a decision tree), by introducing randomization into its construction procedure and then making an ensemble out of it. This algorithm encompasses several works from the literature. When random subsets of the dataset are drawn as random subsets of the samples, then this algorithm is known as Pasting [R15]. If samples are drawn with replacement, then the method is known as Bagging [R16]. When random subsets of the dataset are drawn as random subsets of the features, then the method is known as Random Subspaces [R17]. Finally, when base estimators are built on subsets of both samples and features, then the method is known as Random Patches [R18]. So bagging is simply keep the number of features as the same, but choose different data, and then final result? take an average. So it is basically bootstrap and then take average result. While Pasting is only take the subsets of the samples, which means, only combination not permutation is taken from the total samples. On the other hand, when features becomes randomly chosen, means you are in the situation that you are not confident about your chosen features can be useful and some features might be interconnected with others so it might be good to just select a few of them. And then perhaps, I don't know, take an average. Also, please note that in Sklearn, the default base estimator for Bagging is decision tree. In many cases, bagging methods constitute a very simple way to improve with respect to a single model, without making it necessary to adapt the underlying base algorithm. As they provide a way to reduce overfitting, bagging methods work best with strong and complex models (e.g., fully developed decision trees), in contrast with boosting methods which usually work best with weak models (e.g., shallow decision trees). Random forest In random forests (see RandomForestClassifier and RandomForestRegressor classes), each tree in the ensemble is built from a sample drawn with replacement (i.e., a bootstrap sample) from the training set. In addition, when splitting a node during the construction of the tree, the split that is chosen is no longer the best split among all features. Instead, the split that is picked is the best split among a random subset of the features. As a result of this randomness, the bias of the forest usually slightly increases (with respect to the bias of a single non-random tree) but, due to averaging, its variance also decreases, usually more than compensating for the increase in bias, hence yielding an overall better model.
Bagging has a single parameter, which is the number of trees. All trees are fully grown binary tree (unpruned) and at each node in the tree one searches over all features to find the feature that best splits the data at that node. Random forests has 2 parameters:
why dimension reduction Dimension is the number of features. Too much dimension leads to too many effective details in order to not overfitting. So for the most of the time, data is always not enough. On the other hand, less dimension will lead to less computational time. If the information between the different sample is conserved, it means, some feature is actually deleted. So dimension reduction is actually, deleting the most unwanted features or unimportant one as a whole. Random projection Dimensionality reduction techniques generally use linear transformations in determining the intrinsic dimensionality of the manifold as well as extracting its principal directions. For this purpose there are various related techniques, including: principal component analysis, linear discriminant analysis, canonical correlation analysis, discrete cosine transform, random projection, etc. Random projection is a simple and computationally efficient way to reduce the dimensionality of data by trading a controlled amount of error for faster processing times and smaller model sizes. The dimensions and distribution of random projection matrices are controlled so as to approximately preserve the pairwise distances between any two samples of the dataset. The core idea behind random projection is given in the Johnson-Lindenstrauss lemma, which states that if points in a vector space are of sufficiently high dimension, then they may be projected into a suitable lower-dimensional space in a way which approximately preserves the distances between the points. The mathematical backaground for random projection: Johnson–Lindenstrauss lemma In mathematics, the Johnson–Lindenstrauss lemma is a result named after William B. Johnson and Joram Lindenstrauss concerning low-distortion embeddings of points from high-dimensional into low-dimensional Euclidean space. The lemma states that a small set of points in a high-dimensional space can be embedded into a space of much lower dimension in such a way that distances between the points are nearly preserved. Weakness: Though this allows some degree of visualization of the data structure, the randomness of the choice leaves much to be desired. In a random projection, it is likely that the more interesting structure within the data will be lost. Pca Principal component analysis (PCA) is a statistical procedure that uses an orthogonal transformation to convert a set of observations of possibly correlated variables into a set of values of linearly uncorrelated variables called principal components. The number of principal components is less than or equal to the number of original variables. This transformation is defined in such a way that the first principal component has the largest possible variance (that is, accounts for as much of the variability in the data as possible), and each succeeding component in turn has the highest variance possible under the constraint that it is orthogonal to the preceding components. The resulting vectors are an uncorrelated orthogonal basis set. The principal components are orthogonal because they are the eigenvectors of the covariance matrix, which is symmetric. PCA is sensitive to the relative scaling of the original variables. PCA can be thought of as fitting an n-dimensional ellipsoid to the data, where each axis of the ellipsoid represents a principal component. If some axis of the ellipse is small, then the variance along that axis is also small, and by omitting that axis and its corresponding principal component from our representation of the dataset, we lose only a commensurately small amount of information. To find the axes of the ellipse, we must first subtract the mean of each variable from the dataset to center the data around the origin. Then, we compute the covariance matrix of the data, and calculate the eigenvalues and corresponding eigenvectors of this covariance matrix. Then, we must orthogonalize the set of eigenvectors, and normalize each to become unit vectors. Once this is done, each of the mutually orthogonal, unit eigenvectors can be interpreted as an axis of the ellipsoid fitted to the data. The proportion of the variance that each eigenvector represents can be calculated by dividing the eigenvalue corresponding to that eigenvector by the sum of all eigenvalues. It is important to note that this procedure is sensitive to the scaling of the data, and that there is no consensus as to how to best scale the data to obtain optimal results. In the data science notes, you will see examples of scaling effects. So normalize using preprocessing is important!! Weakness These methods can be powerful, but often miss important non-linear structure in the data. Manifold learning - iSOMAP Due to weakness of PCA and Random Projection, a nonlinear method to learn nonlinear data structure is found.
Manifold Learning can be thought of as an attempt to generalize linear frameworks like PCA to be sensitive to non-linear structure in data. Though supervised variants exist, the typical manifold learning problem is unsupervised: it learns the high-dimensional structure of the data from the data itself, without the use of predetermined classifications. Isomap seeks a lower-dimensional embedding which maintains geodesic distances between all points. mODEL EVALUATION IN GEneral For a specific question, determine which one is better Randomly divide datasets in to 1) training 2) validation 3) test Cross-validated is considered if data is limited EVALUATE A CLASSIFIER - Confusion matrix Definition: entry i, j in a confusion matrix is the number of observations actually in group i, but predicted to be in group j. Command:
ROC curveSensitivity: predicted true / total true
Specificity: predicted false / total false ROC curve = fpr (false predicted value) v.s. ppr (positive predicted value) For a given Y_true and Y_score, the ROC curve is plotted by changing the threshold of the mapping from Y_score to Y_predict, (remember that we are working on classification) And it begins with a high threshold and end up with a low threshold, so at first, almost everypoint is defined as zero. so ppr and fpr both are zero, so this is the reason why ROC curve start from zero. Similarly it ends up at 1,1. |
AuthorShaowu Pan 
Archives
December 2017
Categories
All
|
 RSS Feed
