Basic git command 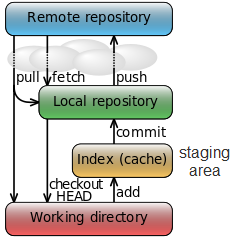 Fig 1. Fig 1. 1. git init: is used to create a local repo 2. git clone: if you have repo already in your github.. just use git clone and the address of your git. 3. git add : add the files to be tracked, add them into staging area (after I realize the structure of git, see Figure 1) 4. git remote add origin: it will connect the remote named as origin (this is used when you want to link a local repo to a repo in github) 5. git push -u origin master: will push the commits to origin and to the master branch (usually git push --all will push all the branches to remote) 6. git checkout -b branchname: it will create a new branch and GO THERE (git branch name will do the same thing but not checking out) 7. git rm: will delete the git tracking for a certain file AND delete the file Data dredging  I understand data dredging as, taking too much from the data than it actually contains. This idea also name as data fishing, data snooping, equation-fitting and p-hacking.. (I don't know the later two) The causes usually are drawing conclusions from non-representative data. PREDICTION V.S. INFERENCEThe difference is that prediction, is usually something in the future and can be validated easily. While inference, is something can perhaps never being verified. PYTHON PASS-BY-REFERENCE OR PASS BY VALUE? I found this problem when I tried to make a list with each element is a new list, where it contains a certain number of vectors.
The problem is solved by considering a 3D numpy array and work out by the way we do in MATLAB.. The cause is that Python automatically controls what to be pass-by-reference or by value. The thing we learnt for MATLAB is usually pass by value. However, list.append is a function could be pass-by-reference. import numpy as np from sklearn import linear_model, metrics, cross_validation import matplotlib.pyplot as plt %matplotlib inline np.random.seed(1) x = np.linspace(0, 6.14, 101) y = np.sin(x) + 0.3*np.random.randn(len(x)) N = 10 X = np.zeros((N,N,len(x))); trscore = np.zeros((N,1)) tescore = np.zeros((N,1)) trerr = np.zeros((N,1)) teerr = np.zeros((N,1)) aselect = np.add(range(N),1) for n in range(N): for i in range(n+1): if i == 0: X[n,i,:] = x else: X[n,i,:] = x**(i+1) for n_select in aselect: X_train, X_test, y_train, y_test = cross_validation.train_test_split(np.transpose(X[n_select-1])[:,0:n_select], y, test_size=0.33, random_state =48) lrg = linear_model.LinearRegression(n_jobs=-1) # print n_select,np.transpose(X[n_select-1])[:,0:n_select] lrg.fit(X_train,y_train) print 'when feature numer = ', n_select ,'abs(coef)_max = ', max(abs(lrg.coef_)) print 'when feature numer = ', n_select ,'abs(intercept)_max = ', max(abs(lrg.intercept_.ravel())) print '-------------------' tescore[n_select-1] = lrg.score(X_test,y_test) trscore[n_select-1] = lrg.score(X_train,y_train) trerr[n_select-1] = metrics.mean_squared_error(lrg.predict(X_test) ,y_test) teerr[n_select-1] = metrics.mean_squared_error(lrg.predict(X_train) ,y_train) fig = plt.figure(figsize=(16,4)) ax1 = fig.add_subplot(1,2,1) ax1.plot(aselect,tescore,c='blue',lw=3,label='test data') ax1.plot(aselect,trscore,c='red',lw=3,label='training data') ax1.legend(loc='best') ax1.set_xlabel('number of feature') ax1.set_ylabel('R2 score') ax2 = fig.add_subplot(1,2,2) ax2.plot(aselect, trerr, c='blue',lw=3,label='test data') ax2.plot(aselect, teerr, c='red',lw=3,label='training data') ax2.legend(loc='best') ax2.set_xlabel('number of feature') ax2.set_ylabel('MSE') |
AuthorShaowu Pan 
Archives
December 2017
Categories
All
|
 RSS Feed
